Запрос
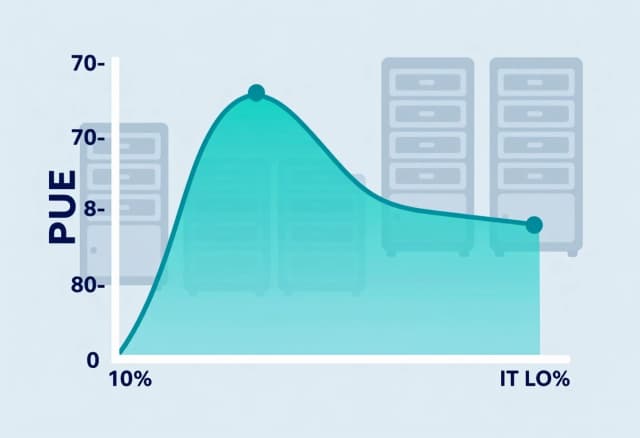
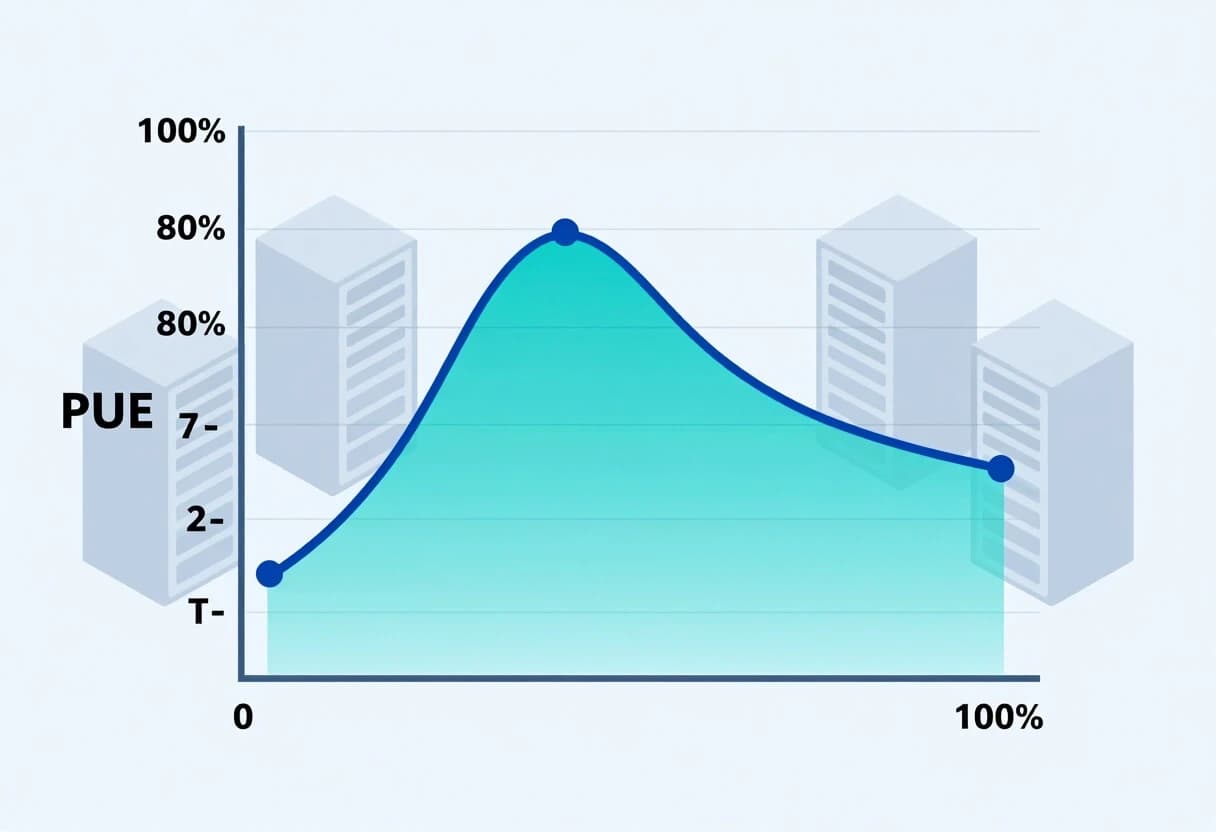
Создать свою версию!Clean isometric vector infographic showing a line graph. X-axis represents IT load percentage (0-100%), Y-axis represents PUE value. The curve starts high at low load, dips to an optimal zone around 70-80% load, then slightly rises. Background shows faint silhouettes of server racks at different heights. Flat design, blue-teal-cyan color palette, gray‑blue background, minimal professional tech style, smooth gradient curve, no text, no grid clutter.